White Group
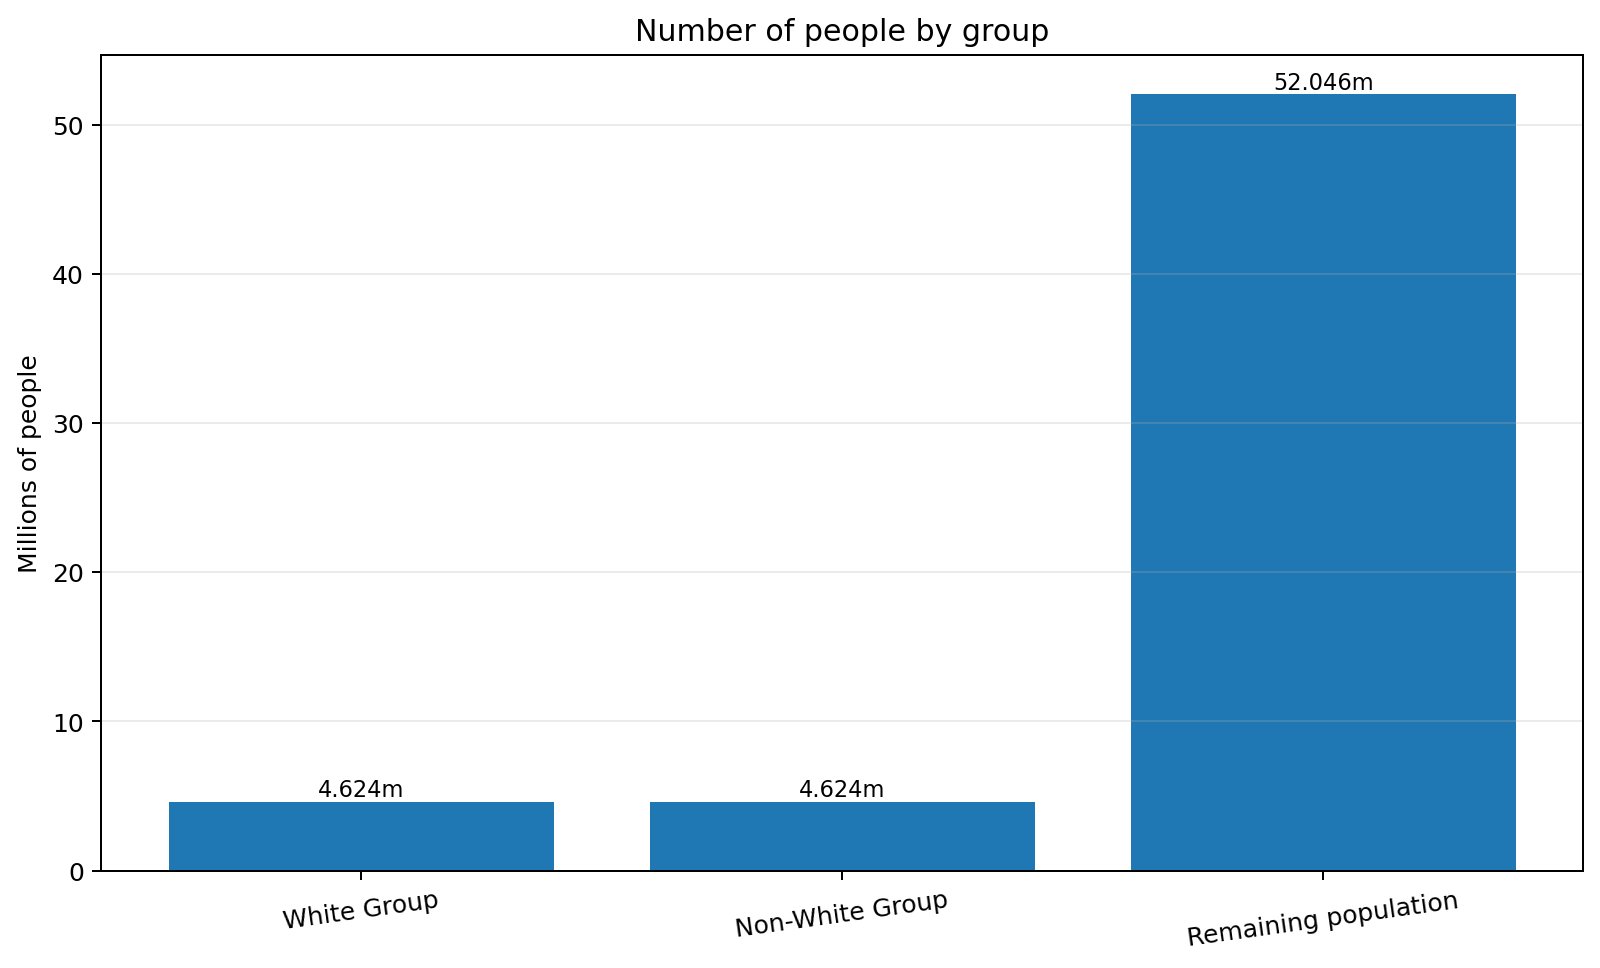
4,623,548 people
7.54% of the national population.
South Africa · 2023
A transparent benchmark model using Stats SA population data and the Momentum-Unisa Household Wealth Report for the fourth quarter of 2023.
Research, calculations, charts and page preparation were completed with assistance from ChatGPT by OpenAI.
Overview
White Group contains the wealthiest 4,623,548 white people in South Africa. Non-White Group contains the same number of the wealthiest non-white people. Group 3 contains everyone who is not included in the first two groups.
4,623,548 people
7.54% of the national population.
4,623,548 people
7.54% of the national population.
52,046,369 people
84.91% of the national population.
Comparison
The groups run from left to right, with the requested measures shown as rows.
| Metric | White Group | Non-White Group | 3. Remaining population |
|---|---|---|---|
| Number of people | 4,623,548 | 4,623,548 | 52,046,369 |
| Share of national population | 7.54% | 7.54% | 84.91% |
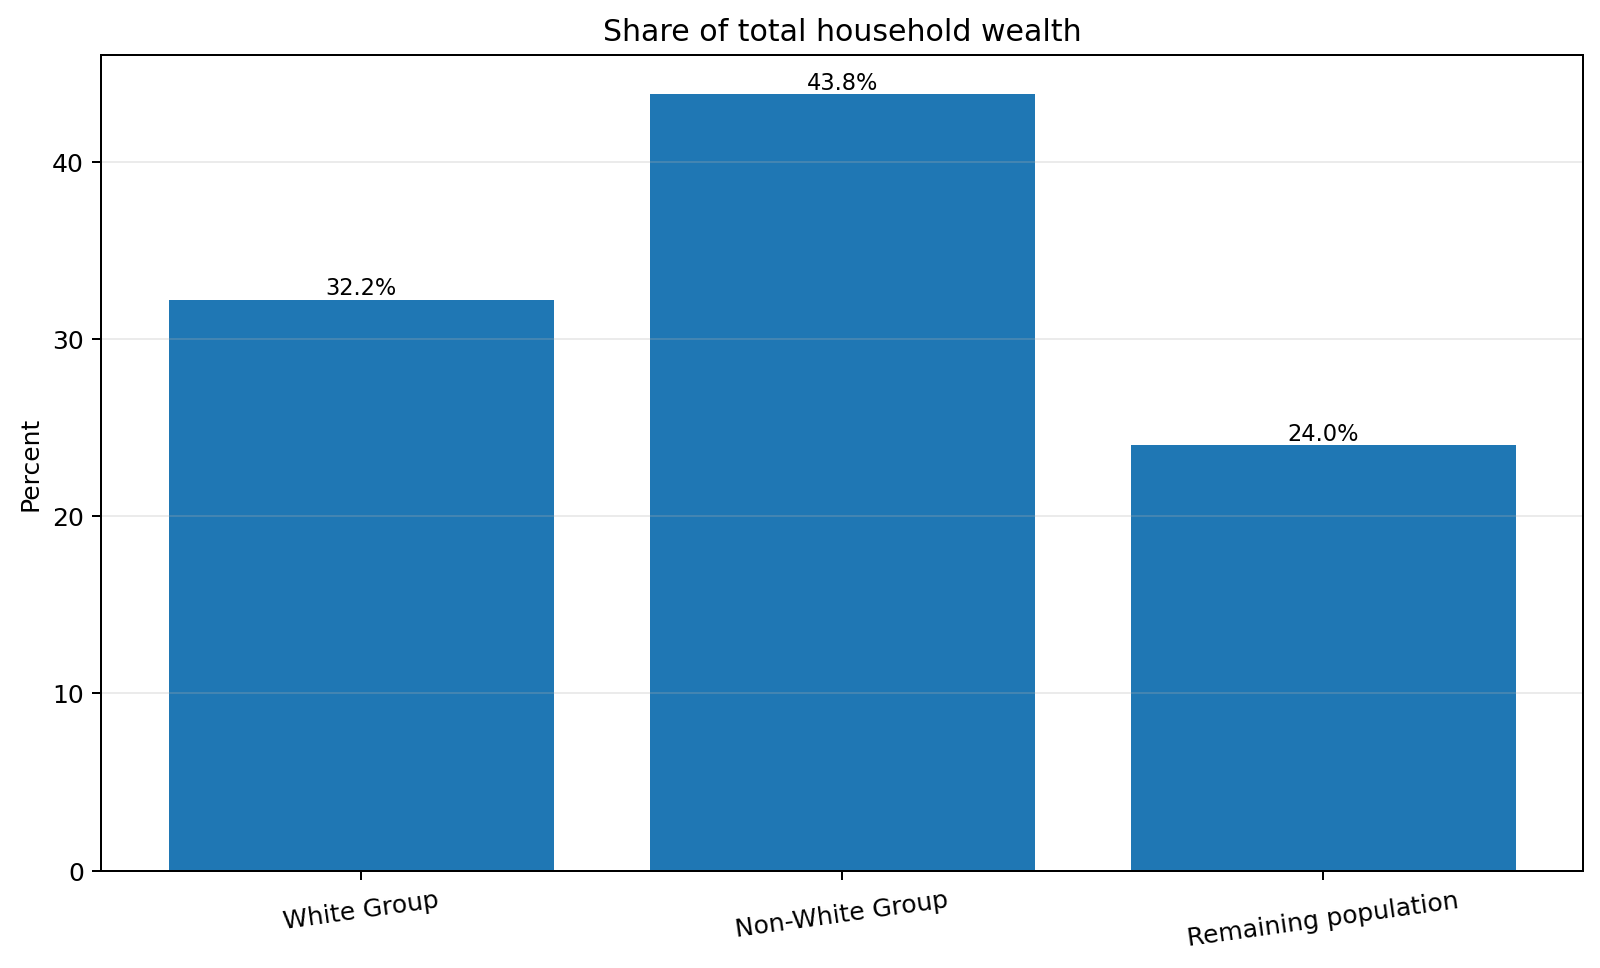
| Share of total wealth | 32.2% | 43.8% Estimated | 24.0% |
| Share of total wealth in Rand | R6.226 trillion | R8.469 trillion | R4.641 trillion |
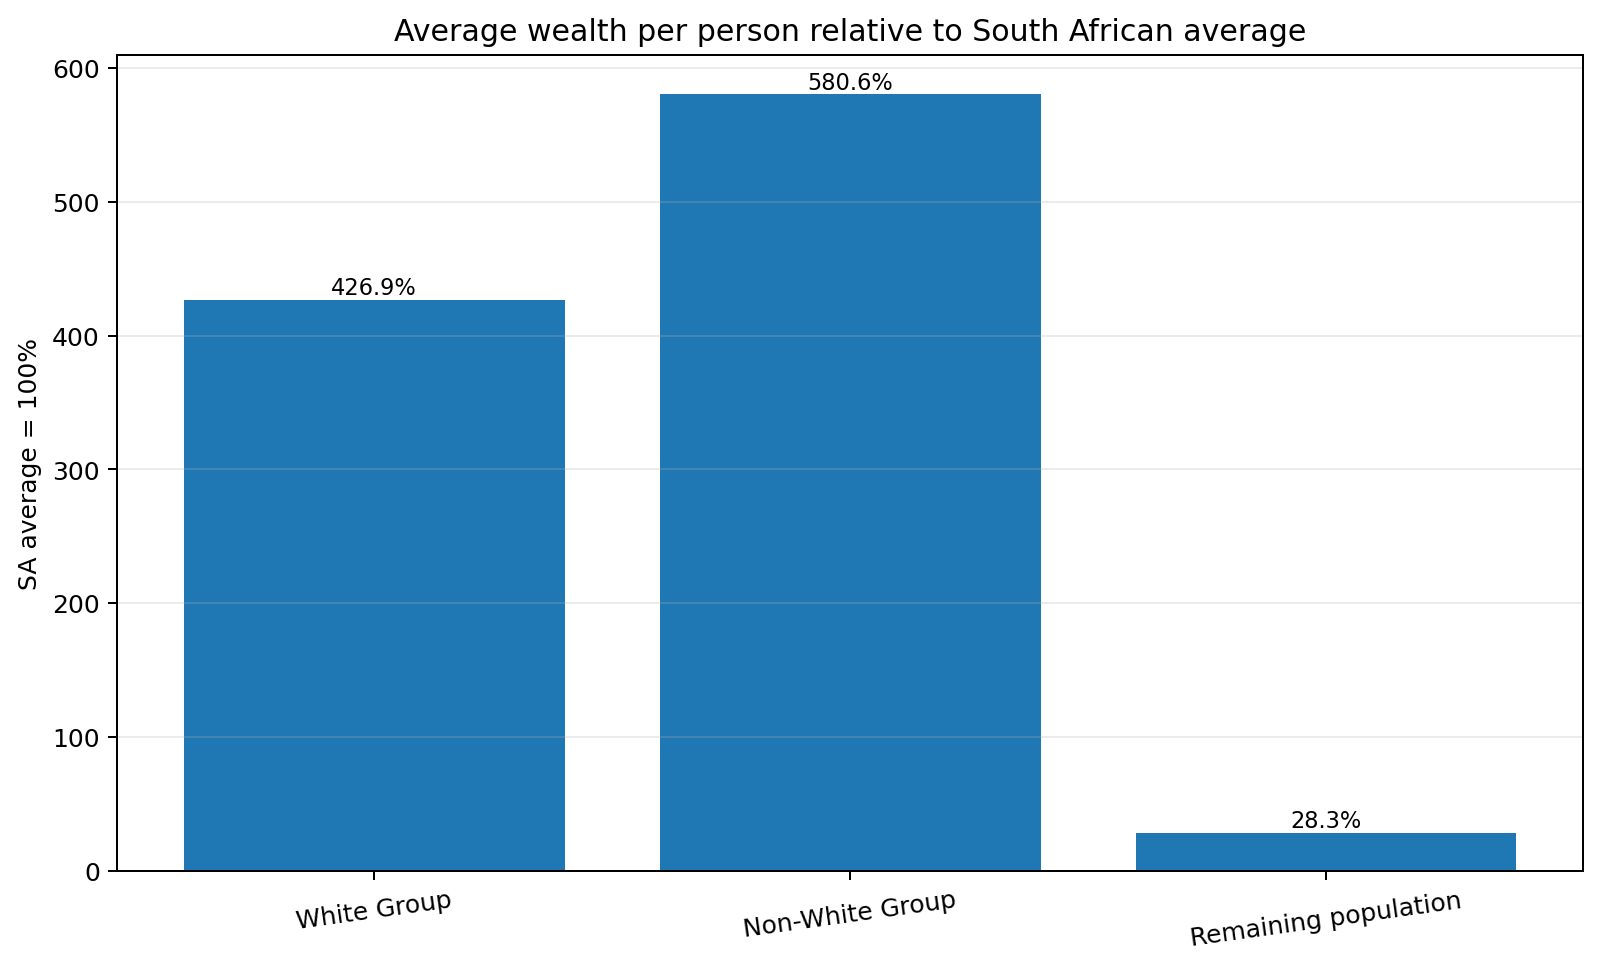
| Average wealth per person in % | 426.9% | 580.6% | 28.3% |
| Average wealth per person in Rand | R1,346,640 | R1,831,765 | R89,164 |
| Share of total assets | 19.7% | 51.9% Estimated | 28.4% Estimated |
| Estimated total assets in Rand | R4.370 trillion | R11.506 trillion | R6.305 trillion |
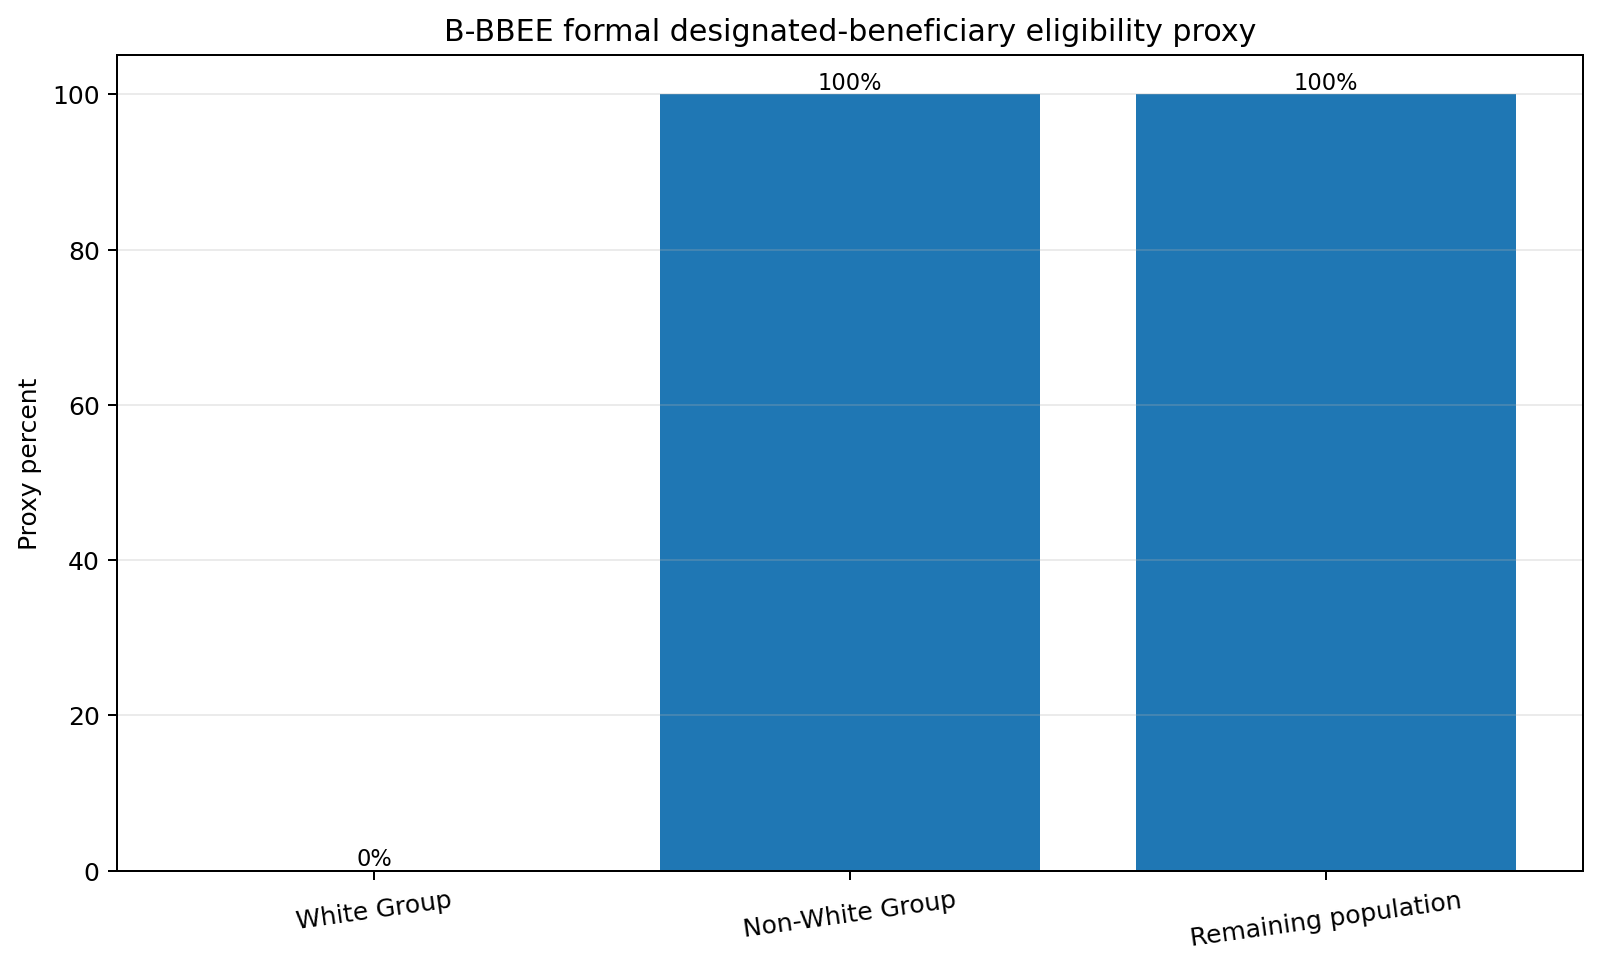
| Formal B-BBEE beneficiary eligibility proxy | 0% | 100% | 100% |
| Access to B-BBEE wealth-growth mechanisms | No direct designated-beneficiary eligibility under the B-BBEE definition. | Formally eligible where citizenship requirements are met. Actual benefits for this custom group are not measured. | Formally eligible where citizenship requirements are met. Practical access and realised benefits are uneven and are not measured here. |
“Average wealth per person in %” is an index where the South African average equals 100%; it is not a percentage share of national wealth.
Charts
Select any chart to open the full-resolution image in a new browser tab.
Method
The report assigns 32.2% of household wealth to white households. Non-White Group receives 43.8%, calculated as 76.0% minus 32.2%.
Group 3 receives 24.0% of wealth, calculated as 100% minus 76%.
After reserving the reported 19.7% white asset share, the remaining 80.3% was allocated between Groups 2 and 3 in proportion to their estimated wealth shares.
Momentum-Unisa measures household wealth, while Stats SA population figures count individuals. Per-person results are modelled approximations.
Groups 1 and 2 together contain approximately 15.09% of the population, not 10%. The 76% combined benchmark is therefore a requested scenario.
The chart shows formal beneficiary eligibility only. No official dataset used here maps realised B-BBEE wealth gains onto these three custom groups.
Follow-up discussion
This section records the main questions raised after the initial analysis, the answers developed with ChatGPT, and an important correction made during the discussion. It compares only the two custom, equal-sized groups defined on this page.
| Measure | White Group: wealthiest 4.624 million white people | Non-White Group: wealthiest 4.624 million non-white people | What the model shows |
|---|---|---|---|
| Population | 4,623,548 | 4,623,548 | The groups are equal in size. |
| Modelled total wealth | R6.226 trillion | R8.469 trillion | Non-White Group holds about R2.243 trillion more. |
| Average wealth per person | R1,346,640 | R1,831,765 | Non-White Group averages about R485,125 more per person. |
| Average four-person household | Approximately R5,386,561 | Approximately R7,327,062 | Non-White Group averages about R1,940,501 more, or 36.0%. |
| Formal B-BBEE beneficiary eligibility | No direct designated-beneficiary status | Potentially eligible where the legal citizenship requirements are met | The formal eligibility advantage lies with Non-White Group. |
| Guaranteed monetary B-BBEE benefit | None established | None established | The available data cannot calculate an average Rand benefit received. |
Direct finding
Within this custom comparison, Non-White Group is wealthier on average than White Group and is also the group that may qualify for B-BBEE designated-beneficiary recognition. The measurable economic advantage in this model therefore lies with Non-White Group, not White Group.
Important correction
ChatGPT initially referred to continuing racial inequality in favour of White Group. When asked to demonstrate that claim specifically between these two groups, it could not do so and corrected the record. The page now states the result supported by the model: Non-White Group has the higher average wealth.
Group averages
Saying that Non-White Group is wealthier on average does not mean that every Non-White Group household is wealthier than every White Group household. Individual exceptions do not invalidate a comparison of group averages. The discussion used the Ramaphosa household as a simple illustration of this distinction.
From a present-day, household-by-household perspective, it is reasonable to question the fairness of preferring the modelled Non-White Group household when it is already approximately R1.94 million wealthier than the modelled White Group household. Current South African constitutional law nevertheless permits properly designed remedial measures under section 9(2); that does not make every racial distinction automatically fair or immune from review.
See the Constitution, section 9 and Minister of Finance v Van Heerden.
ICERD permits special measures aimed at achieving substantive equality, but the UN Committee says that they should be necessary, proportionate, based on current evidence, monitored, temporary in character, and discontinued once their equality objectives have been sustainably achieved. A missing calendar expiry date is not automatically unlawful, but the absence of clear objectives, review criteria and an exit framework is a legitimate concern.
See ICERD and CERD General Recommendation No. 32.
No. Both groups are deliberately defined using the same selection rule: the wealthiest 4.624 million people in each racial category. The model shows Non-White Group’s greater average wealth and its potential B-BBEE eligibility, but it cannot determine how much wealth resulted from B-BBEE, inheritance, investment returns, education, business ownership, age, location or other factors.
It supports a serious argument that the policy may be insufficiently broad-based or may concentrate opportunities among already advantaged beneficiaries. It does not, on its own, prove causation. A causal claim would require evidence linking particular B-BBEE rules and benefits to the measured change while separating the effects of unemployment, education, economic growth and other factors.
As equal-sized groups in this model, Non-White Group is approximately 36% wealthier per person than White Group. Non-White Group may also qualify for designated B-BBEE recognition, while White Group is excluded from that recognition because it is white. The analysis therefore cannot identify any remaining average-wealth inequality in favour of White Group over Non-White Group. It also cannot quantify the actual B-BBEE benefit received by either household or claim that every household follows the group average.
Transparency
JusticeSA used ChatGPT by OpenAI to help retrieve and organise source data, perform the stated calculations, create the comparison table and charts, and prepare this bilingual web page. The assumptions and limitations are disclosed on this page, and readers should consult the cited primary sources.
AI assistance disclosure
ChatGPT assisted with research, arithmetic, modelling, wording, translation, spreadsheet preparation and chart generation. The grouping requested in the prompt is a custom analytical scenario and is not an official Stats SA, Momentum-Unisa or B-BBEE Commission classification.
The original prompt is reproduced below without rewriting:
There were about 4.624 million white people in South Africa in South Africa in 2023 according to Stats SA.
Retrieve the total number of white people from StatsSA for 2023.

Read the report from https://sls-fresco.momentum.co.za/files/documents/financial-wellness/momentum-unisa-household-wealth-q4-2023.pdf
I want you to concentrate on three groups in that report.
The 1st group constitute all white people in South Africa which you retrieved above. That group in that report is designated as "white".
The 2nd group constitute ONLY the top Wealthiest equivalent number of people that are not of the white group.
The 3rd group constitute the rest of South Africa which contains all people which are not in the 1st 2 groups.
Remember that 76% of the wealth is owned by the top 10% of people according to that report.

Now, using that information as well as other information on the internet, create a Comparative Table of the 3 groups.

Calculate as close as you can the following.
Number of people in the group.
Share of Total Wealth in %.
Share of Total Wealth in Rand.
Average Wealth per person in %.
Average Wealth per person in Rand.
Share of Total Assets.
Access to B-BEE Wealth Growth Trends.

Make sure the 3 groups are shown from left to right at the top.
Beneath that should be the following rows and the totals in the columns for each of the groups.
If that is not the case, transpose the rows and columns of the table

Create a bar chart comparing Number of people,
another comparing Share of Total Wealth in % ,
another comparing Average Wealth per person in %
and also a chart showing access to B-BBEE

According to the report 10% of people hold 76% of wealth. That leaves 24% for the rest
Sources
Used for the unrounded 2023 total and white population counts.
Open Stats SA workbookShows the rounded white population figure of approximately 4.624 million.
Open Stats in BriefUsed for household wealth, asset totals, racial shares and wealth concentration.
Open wealth reportUsed for the formal definition of qualifying designated beneficiaries.
Open B-BBEE Commission guidanceIncludes the table, formulas, sources and chart data.
This page presents a transparent scenario based on the requested grouping and allocation assumptions. It is not a directly observed distribution of individual wealth by race or B-BBEE participation.